3QFY2018 Result Update | Cable
February 2, 2018
Siyaram Silk Mills
BUY
CMP
`627
Performance Update
Target Price
`813
Y/E March (` cr)
3QFY18
3QFY17
% yoy
2QFY18
% qoq
Investment Period
12 month
Net sales
394
339
16.1
428
(8.1)
EBITDA
50
42
20.3
70
(28.0)
Stock Info
EBITDA margin (%)
12.8
12.4
45bp
16.3
(353bp)
Sector
Cable
Adjusted PAT
22
14
64.1
30.7
(27.0)
Market Cap (Rs cr)
2,939
Source: Company, Angel Research
Net Debt
314
For 3QFY2018, Siyaram Silk Mills (SSM) posted good set of results, exceeding our
Beta
0.6
52 Week High / Low
799/287
expectations on both, top-line as well as bottom-line fronts. Revenues grew by
Avg. Daily Volume
2,781
~16% yoy (above our estimate). On the operating front, the company reported
Face Value (Rs)
10
operating margin improvement. On the bottom-line front, SSM reported growth of
BSE Sensex
35,067
Nifty
10,761
~64% yoy to `22cr on the back of strong top-line growth, higher other income and
Reuters Code
SIYR.BO
lower taxes.
Bloomberg Code
SIYA IN
Top-line driven by strong volume growth: The Company’s top-line grew by ~16%
yoy to `394cr on the back of strong growth in volume and price hike.
Shareholding Pattern (%)
Strong revenue growth and operating performance boost overall profitability: On
Promoters
67.1
the operating front, the company’s margin has improved by 45bbp yoy at 12.8%.
MF / Banks / Indian Fls
9.4
The company reported ~64% yoy rise in its net profit to `22cr on the back of strong
FII / NRIs / OCBs
1.7
revenue growth, higher other income and lower taxes.
Indian Public / Others
21.8
Outlook and Valuation: Going forward, we expect SSML to report a net sales CAGR
of ~12% to ~`1,981cr and adj.net profit CAGR of ~16% to `126cr over FY2017-
Abs. (%)
3m 1yr 3yr
19E on back of market leadership in blended fabrics, strong brand building, wide
Sensex
6.9
27.6
23.3
distribution channel, strong presence in tier II and tier III cities and emphasis on
SSM
11.1
130.5
232.0
latest designs and affordable pricing points. At the current market price, SSML
trades at an inexpensive valuation. We have a buy recommendation on the stock
and target price of `813.
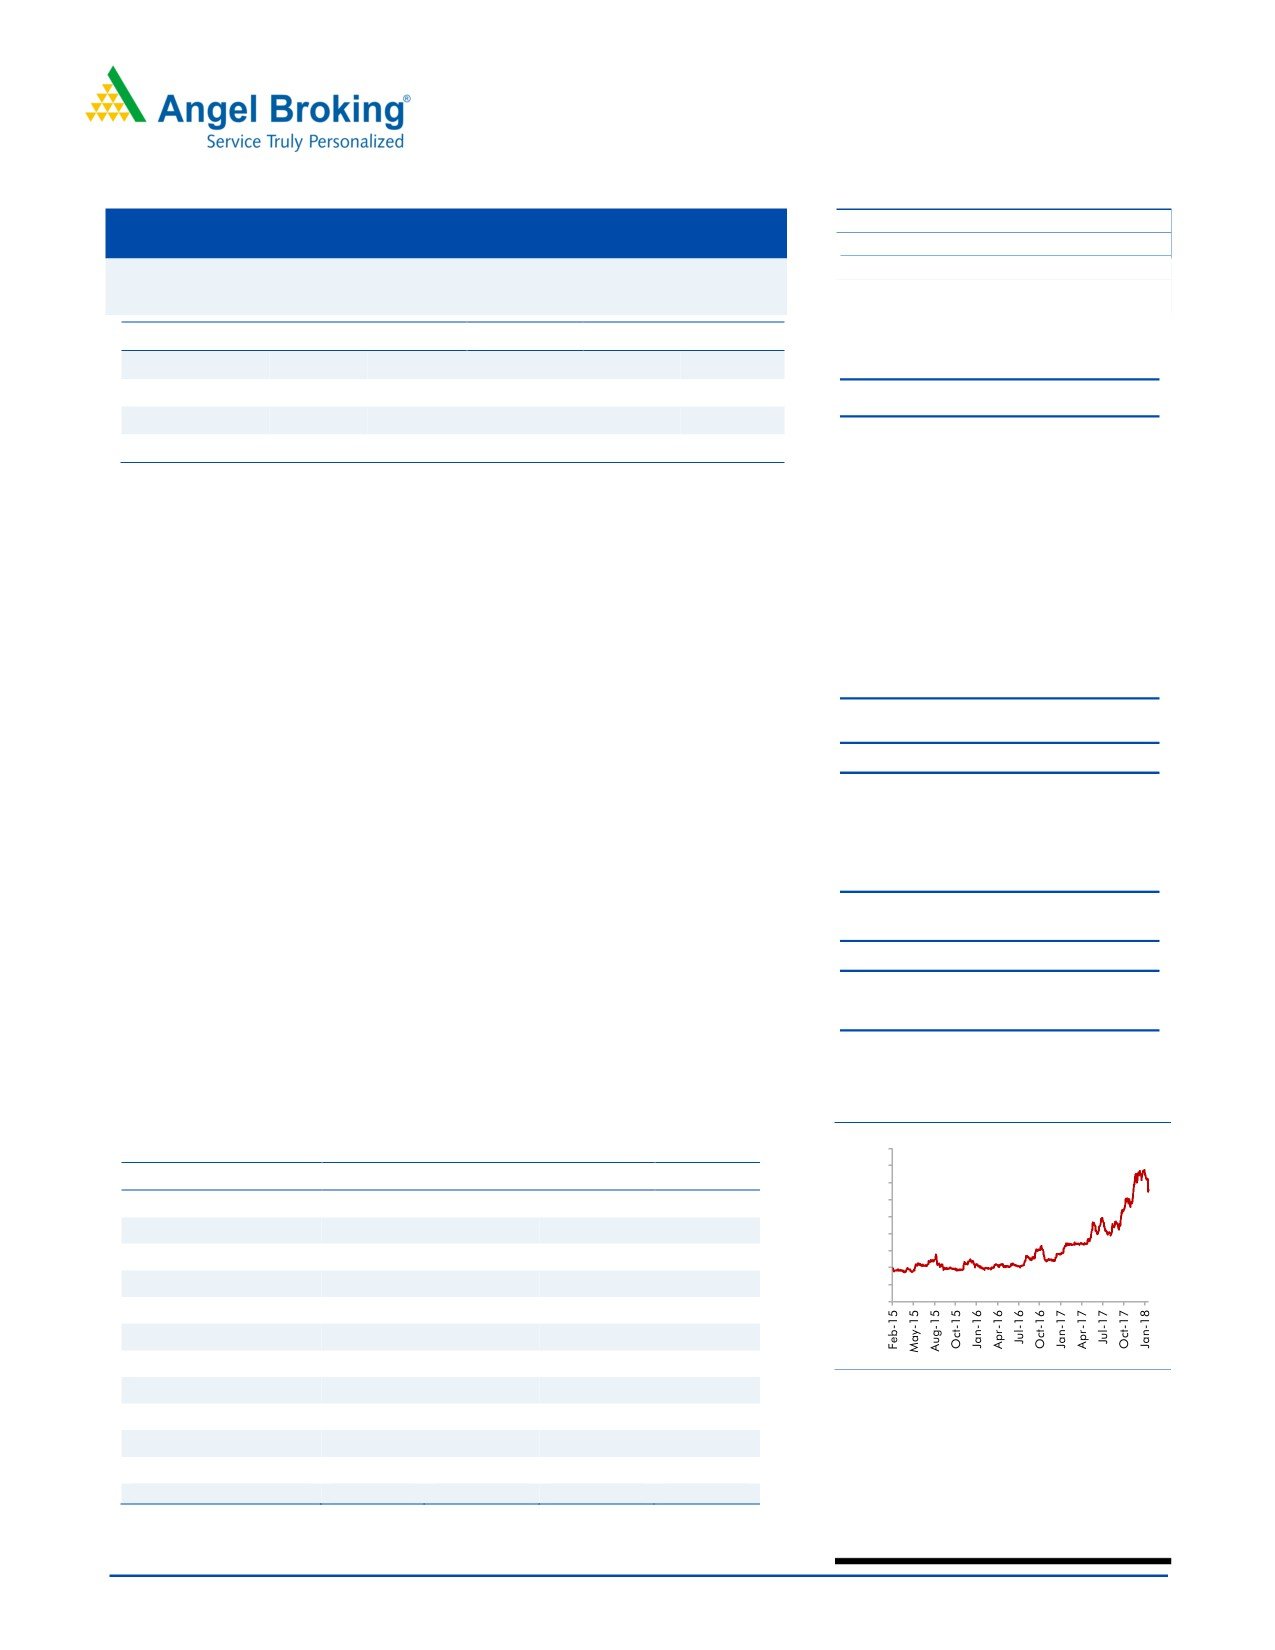
Historical share price chart
Key Financials
900
800
Y/E March (` cr)
FY2016
FY2017
FY2018E
FY2019E
700
600
Net sales
1,619
1,574
1,769
1,981
500
% chg
7.2
(2.8)
12.4
12.0
400
300
Adj. Net profit
88
91
108
126
200
% chg
87.6
91.0
108.2
125.5
100
0
EBITDA margin (%)
11.6
12.5
13.0
13.0
EPS (`)
18.7
19.4
23.1
26.8
P/E (x)
35.3
33.9
28.5
24.6
P/BV (x)
6.0
5.2
4.5
3.9
Source: Company, Angel Research
RoE (%)
17.1
15.4
15.7
15.7
Amarjeet S Maurya
RoCE (%)
16.3
14.3
15.8
16.5
022-40003600 Ext: 6831
EV/Sales (x)
2.1
2.2
1.9
1.7
EV/EBITDA (x)
18.2
17.3
14.8
12.9
Source: Company, Angel Research Note: CMP as of February 02, 2018
Please refer to important disclosures at the end of this report
1
KEI Industries| 3QFY2018 Result Update
Exhibit 1: 3QFY2018 Performance
Y/E March (` cr) 3QFY18 3QFY17% chg (yoy) 2QFY18% chg (qoq) 9MFY18 9MFY17 % chg
Net Sales
394
339
16.1
428
(8.1)
1,137
1,045
8.8
Net raw material
163.2
141
15.9
182.29
(10.5)
474.3
472.19
0.4
(% of Sales)
41.5
41.6
(9)
42.6
(110)
41.7
45.2
Employee Cost
47
42
11.5
47
1.4
138
124
11.2
(% of Sales)
12.0
12.5
(50)
10.9
112
12.1
11.9
Other Expenses
133
114
16.6
129
2.6
377
325
15.8
(% of Sales)
33.7
33.6
14
30.2
351
33.1
31.1
Total Expenditure
343
297
15.5
358
(4.2)
989
922
7.3
Operating Profit
50
42
20.3
70
(28.0)
148
124
20
OPM (%)
12.8
12.4
45
16.3
(353)
13.00
11.82
118
Interest
9
9
2.2
7
38.5
22
26 (14.4)
Depreciation
15
17
(10.9)
15
(3.4)
45
43
5.2
Other Income
8
5
44.4
#DIV/0!
18
18
(2.4)
PBT
34
22
57.7
48
(28.7)
98
73
34.6
(% of Sales)
8.7
6.4
11.2
8.6
7.0
Tax
12
8
46.9
17
(31.7)
35
26
35.3
(% of PBT)
34.4
36.9
35.9
35.4
35.2
Reported PAT
22
14
64.1
31
(27.0)
64
47
34.3
PATM
5.7
4.0
7.2
5.6
4.5
Source: Company, Angel Research
February 2, 2018
2
Siyaram Silk Mills| 3QFY2018 Result Update
Outlook and Valuation
Going forward, we expect SSML to report a net sales CAGR of ~12% to ~`1,981cr
and adj.net profit CAGR of ~16% to `126cr over FY2017-19E on back of market
leadership in blended fabrics, strong brand building, wide distribution channel,
strong presence in tier II and tier III cities and emphasis on latest designs and
affordable pricing points. At the current market price, SSML trades at an inexpensive
valuation. We have a buy recommendation on the stock and target price of `813.
Downside risks to our estimates include
Decline in rural spending: Unseasonal rains or deficient rainfall in the rural areas
may result in lower agriculture output. This, in turn, could result in lower discretionary
spending among rural consumers, which could impact the company’s overall sales.
Competition from the unorganized sector: SSML, being in a sector that’s highly
fragmented, faces intense competition from unorganized players as they usually sell
their products at a much cheaper rate compared to it. However, due to strong
branding efforts, huge distribution network and affordable price points, the
company is easily able to differentiate its products from those of competitors.
Fluctuation in raw material prices: SSML operates in a highly price-sensitive market.
Any fluctuation in raw-material prices can lead to margin compression, as the
company may not be able to pass on the entire increase to the end-user.
Company Background
SSML is the largest manufacturer of blended fabrics in India. The company enjoys a
strong brand presence across the country, with brands such as Siyaram’s, Mistair,
MSD, J. Hampstead and Oxemberg in its kitty. The company has also launched
three premium brands - Royal Linen (linen fabrics for men and women), Moretti
(cotton shirting) and Zenesis (cotton suitings). SSML has built a strong brand
presence in the country through continuous advertisement and brand building efforts
over the past 30 years. The company has created a niche for itself in a highly
competitive industry. It has a wide distribution network comprising 1,600 dealers
and 500 agents supplying to more than 40,000 outlets across India and has ~160
franchise stores. The company operates four plants - one at Tarapur near Mumbai
for weaving and yarn dyeing, two at Daman for garments and one at Silvassa for
weaving.
February 2, 2018
4
Siyaram Silk Mills| 3QFY2018 Result Update
Profit & Loss Statement
Y/E March (` cr)
FY2016
FY2017
FY2018E
FY2019E
Total operating income
1,619
1,574
1,769
1,981
% chg
7.2
(2.8)
12.4
12.0
Total Expenditure
1,432
1,377
1,539
1,724
Cost of Materials
810
739
934
1,046
Personnel
144
169
150
168
Others Expenses
478
470
455
509
EBITDA
188
197
230
258
% chg
7.8
4.8
16.9
12.0
(% of Net Sales)
11.6
12.5
13.0
13.0
Depreciation& Amortisation
42
55
58
60
EBIT
146
142
172
197
% chg
9.6
(2.7)
20.6
15.0
(% of Net Sales)
9.0
9.0
9.7
10.0
Interest & other Charges
30
32
32
32
Other Income
17
26
22
22
(% of PBT)
12.9
18.8
13.6
11.7
Share in profit of Associates
-
-
-
-
Recurring PBT
133
136
162
187
% chg
11.6
2.4
18.8
16.0
Prior Period & Extraordinary Expense/(Inc.)
-
-
-
-
PBT (reported)
133
136
162
187
Tax
45
45
53
62
(% of PBT)
34.0
33.1
33.0
33.0
PAT (reported)
88
91
108
126
Add: Share of earnings of associate
-
-
-
-
ADJ. PAT
88
91
108
126
% chg
11.1
3.9
18.9
16.0
(% of Net Sales)
5.4
5.8
6.1
6.3
Basic EPS (`)
18.7
19.4
23.1
26.8
Fully Diluted EPS (`)
18.7
19.4
23.1
26.8
% chg
11.1
3.9
18.9
16.0
February 2, 2018
5
Siyaram Silk Mills| 3QFY2018 Result Update
Balance Sheet
Y/E March (` cr)
FY2016
FY2017
FY2018E
FY2019E
SOURCES OF FUNDS
Equity Share Capital
9
9
9
9
Reserves& Surplus
503
583
678
788
Shareholders Funds
512
592
687
798
Minority Interest
-
-
-
-
Total Loans
386
400
400
400
Deferred Tax Liability
23
23
23
23
Total Liabilities
920
1,015
1,110
1,220
APPLICATION OF FUNDS
Gross Block
609
639
659
679
Less: Acc. Depreciation
299
354
412
472
Net Block
310
286
247
207
Capital Work-in-Progress
7
7
7
7
Investments
46
46
46
46
Current Assets
774
853
1,002
1,181
Inventories
326
336
388
434
Sundry Debtors
368
367
422
472
Cash
7
40
47
112
Loans & Advances
57
79
106
119
Other Assets
16
31
39
44
Current liabilities
221
182
196
219
Net Current Assets
553
671
806
962
Deferred Tax Asset
4
4
4
4
Mis. Exp. not written off
-
-
-
-
Total Assets
920
1,015
1,110
1,220
February 2, 2018
6
Siyaram Silk Mills| 3QFY2018 Result Update
Consolidated Cashflow Statement
Y/E March (` cr)
FY2016
FY2017
FY2018E
FY2019E
Profit before tax
133
136
162
187
Depreciation
42
55
58
60
Change in Working Capital
(127)
(86)
(127)
(91)
Interest / Dividend (Net)
30
32
32
32
Direct taxes paid
(45)
(45)
(53)
(62)
Others
-
-
-
-
Cash Flow from Operations
33
92
72
127
(Inc.)/ Dec. in Fixed Assets
(112)
(30)
(20)
(20)
(Inc.)/ Dec. in Investments
(46)
-
-
-
Cash Flow from Investing
(66)
(30)
(20)
(20)
Issue of Equity
-
-
-
-
Inc./(Dec.) in loans
78
16
2
3
Dividend Paid (Incl. Tax)
11
11
13
15
Interest / Dividend (Net)
(52)
(55)
(60)
(60)
Cash Flow from Financing
37
(28)
(44)
(41)
Inc./(Dec.) in Cash
4
33
7
65
Opening Cash balances
3
7
40
47
Closing Cash balances
7
40
47
112
February 2, 2018
7
Siyaram Silk Mills| 3QFY2018 Result Update
Key ratios
Y/E March
FY2016
FY2017
FY2018E
FY2019E
Valuation Ratio (x)
P/E (on FDEPS)
35.3
33.9
28.5
24.6
P/CEPS
18.7
19.4
23.1
26.8
P/BV
6.0
5.2
4.5
3.9
Dividend yield (%)
1.6
1.7
2.0
2.3
EV/Sales
2.1
2.2
1.9
1.7
EV/EBITDA
18.2
17.3
14.8
12.9
EV / Total Assets
3.0
2.8
2.6
2.3
Per Share Data (Rs)
EPS (Basic)
18.7
19.4
23.1
26.8
EPS (fully diluted)
18.7
19.4
23.1
26.8
Cash EPS
35.3
33.9
28.5
24.6
DPS
10.5
10.9
13.0
15.1
Book Value
109.3
126.4
146.7
170.3
Returns (%)
ROCE
16.3
14.3
15.8
16.5
Angel ROIC (Pre-tax)
17.3
15.7
17.3
19.0
ROE
17.1
15.4
15.7
15.7
Turnover ratios (x)
Asset Turnover (Gross Block)
2.7
2.5
2.7
2.9
Inventory / Sales (days)
74
78
80
80
Receivables (days)
83
85
87
87
Payables (days)
34
32
31
31
Working capital cycle (ex-cash) (days)
123
131
136
136
Source: Company, Angel Research
February 2, 2018
8
Siyaram Silk Mills| 3QFY2018 Result Update
Research Team Tel: 022 - 39357800
DISCLAIMER
This document is solely for the personal information of the recipient, and must not be singularly used as the basis of any investment
decision. Nothing in this document should be construed as investment or financial advice. Each recipient of this document should make
such investigations as they deem necessary to arrive at an independent evaluation of an investment in the securities of the companies
referred to in this document (including the merits and risks involved), and should consult their own advisors to determine the merits and
risks of such an investment.
Angel Broking Pvt. Limited, its affiliates, directors, its proprietary trading and investment businesses may, from time to time, make
investment decisions that are inconsistent with or contradictory to the recommendations expressed herein. The views contained in this
document are those of the analyst, and the company may or may not subscribe to all the views expressed within.
Reports based on technical and derivative analysis center on studying charts of a stock's price movement, outstanding positions and
trading volume, as opposed to focusing on a company's fundamentals and, as such, may not match with a report on a company's
fundamentals.
The information in this document has been printed on the basis of publicly available information, internal data and other reliable sources
believed to be true, but we do not represent that it is accurate or complete and it should not be relied on as such, as this document is for
general guidance only. Angel Broking Pvt. Limited or any of its affiliates/ group companies shall not be in any way responsible for any
loss or damage that may arise to any person from any inadvertent error in the information contained in this report. Angel Broking Pvt.
Limited has not independently verified all the information contained within this document. Accordingly, we cannot testify, nor make any
representation or warranty, express or implied, to the accuracy, contents or data contained within this document. While Angel Broking
Pvt. Limited endeavours to update on a reasonable basis the information discussed in this material, there may be regulatory, compliance,
or other reasons that prevent us from doing so.
This document is being supplied to you solely for your information, and its contents, information or data may not be reproduced,
redistributed or passed on, directly or indirectly.
Angel Broking Pvt. Limited and its affiliates may seek to provide or have engaged in providing corporate finance, investment banking or
other advisory services in a merger or specific transaction to the companies referred to in this report, as on the date of this report or in
the past.
Neither Angel Broking Pvt. Limited, nor its directors, employees or affiliates shall be liable for any loss or damage that may arise from
or in connection with the use of this information.
Note: Please refer to the important `Stock Holding Disclosure' report on the Angel website (Research Section). Also, please refer to the
latest update on respective stocks for the disclosure status in respect of those stocks. Angel Broking Pvt. Limited and its affiliates may
have investment positions in the stocks recommended in this report.
Disclosure of Interest Statement
Siyaram Silk Mills
1. Analyst ownership of the stock
No
2. Angel and its Group companies ownership of the stock
No
3. Angel and its Group companies' Directors ownership of the stock
No
4. Broking relationship with company covered
No
Note: We have not considered any Exposure below ` 1 lakh for Angel, its Group companies and Directors
Ratings (Returns):
Buy (> 15%)
Accumulate (5% to 15%)
Neutral (-5 to 5%)
Reduce (-5% to -15%)
Sell (< -15%)
February 2, 2018
9